How coverage mapping works
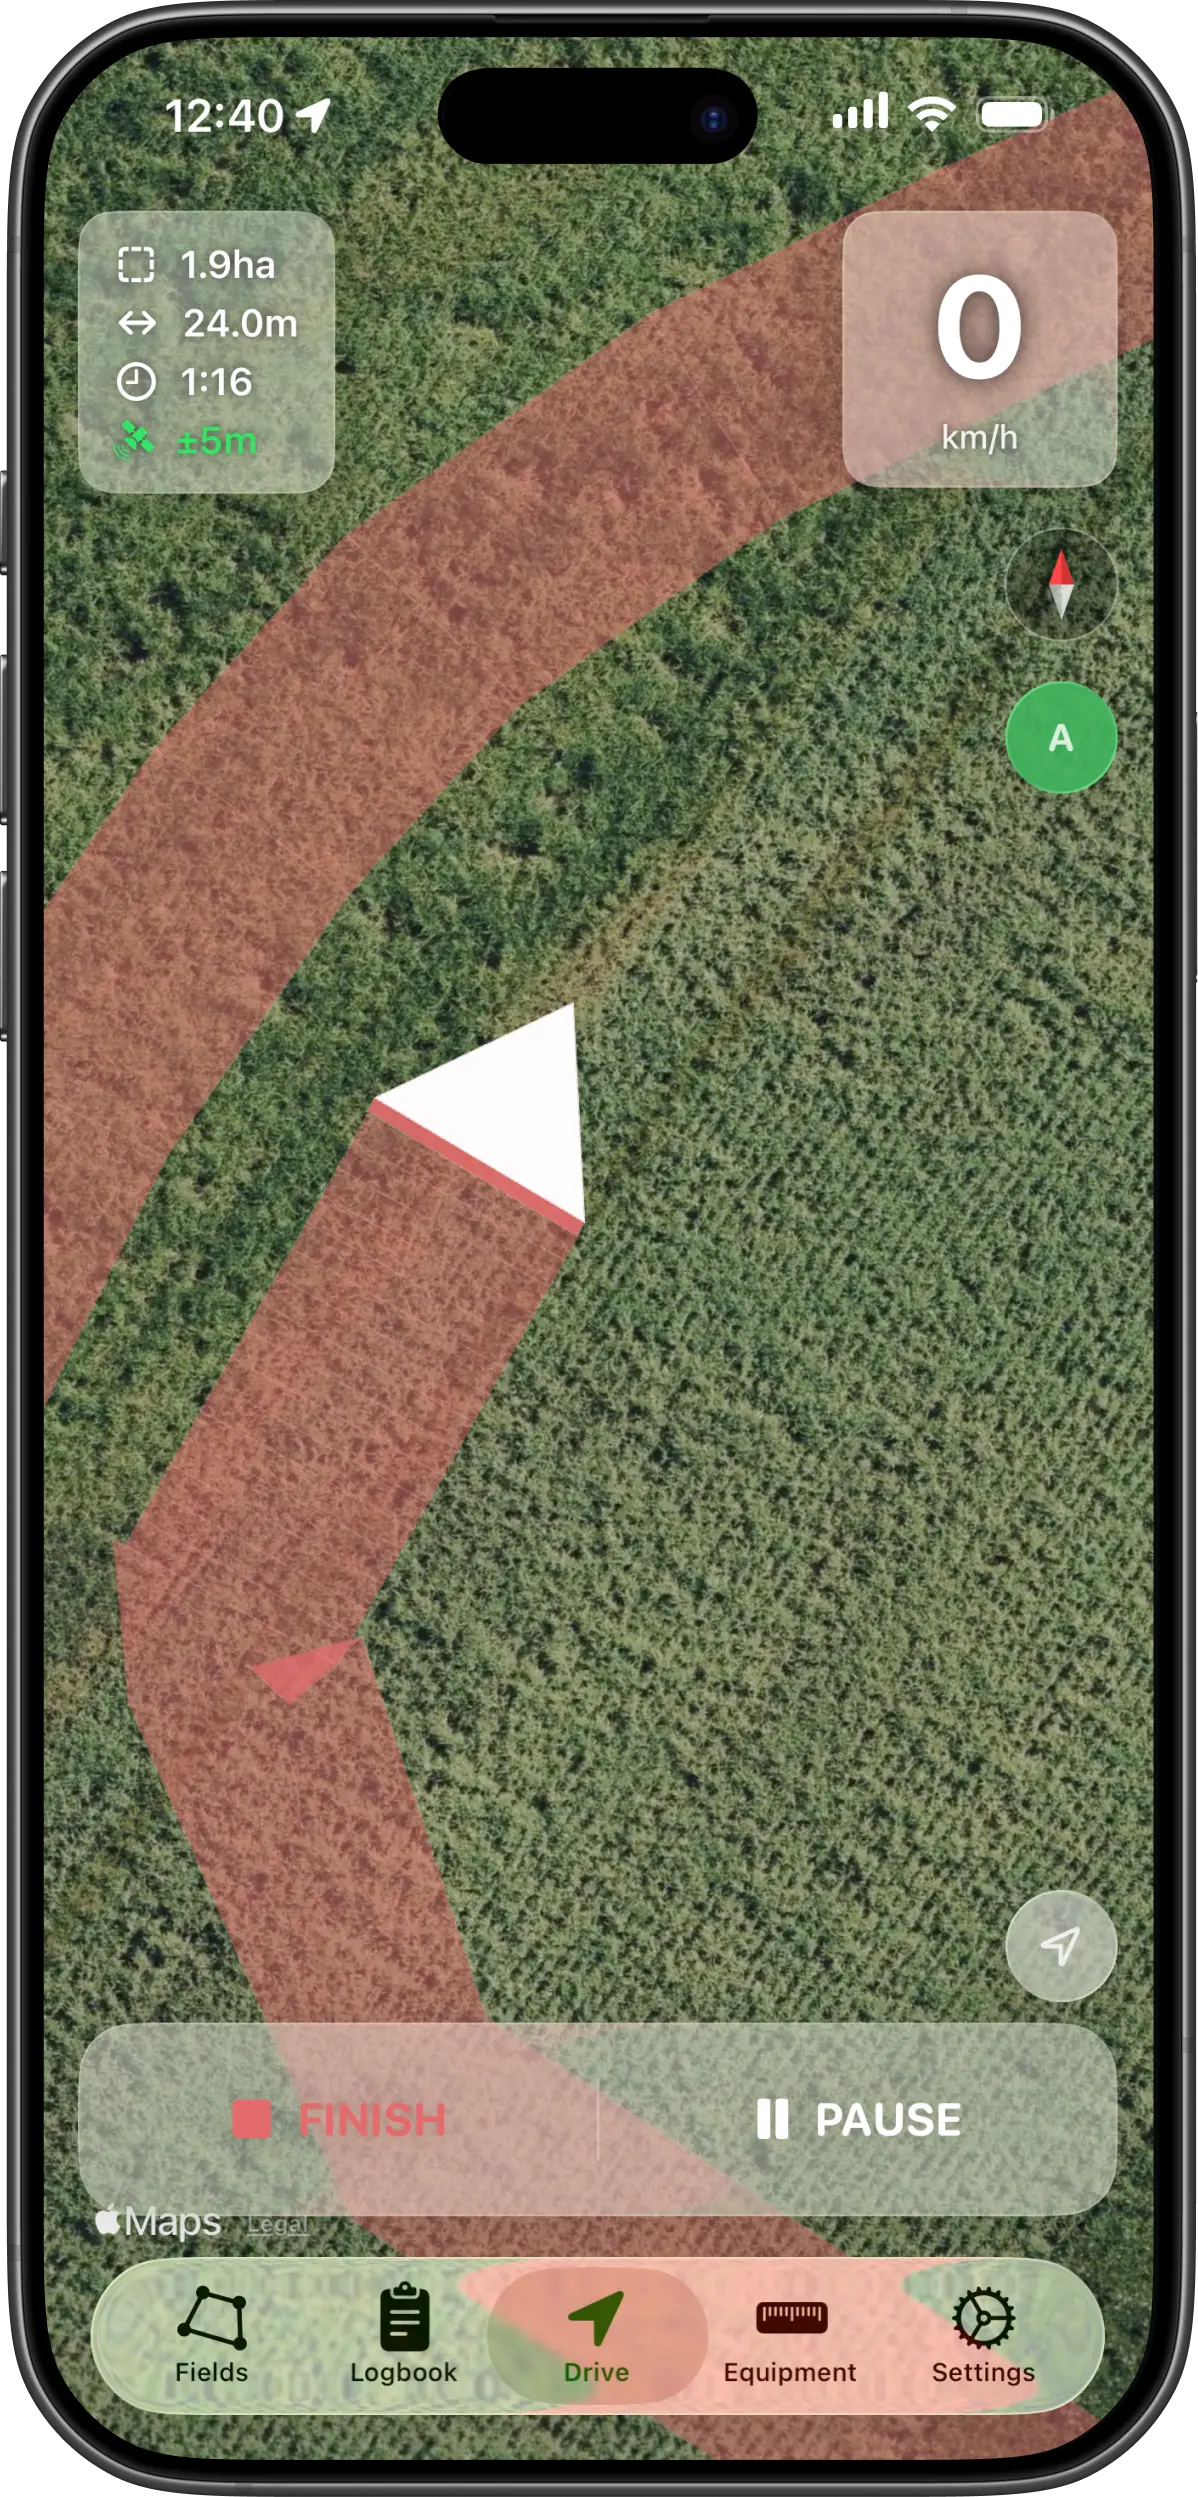
Guidance lines tell you where to go. Coverage mapping tells you where you have been, and in a long day those are different problems. A coverage map paints the worked ground onto the map behind the machine as a band the width of your implement, so the field fills in as you drive and anything you missed stays visibly empty.
What is actually drawn
The app records your position continuously. Between each pair of recorded positions it draws a rectangle: as long as the distance you travelled, as wide as the implement working width you set, centred on where the implement runs. Thousands of those rectangles laid end to end are the coloured band you see trailing the machine.
This is why the working width setting matters twice over. It spaces your guidance lines, and it decides how wide the painted band is. Set it wrong and the map will happily show a field as fully covered when it is not.
Why overlap shows darker
The coverage band is drawn semi-transparent. Where two passes cross, the colours compound and the ground reads darker than single-covered ground. Nothing computes that (it falls out of drawing the passes on top of each other) but it is the most useful thing on the screen, because it makes double application something you notice from the seat rather than something you work out afterwards.
A dark stripe down one side of the field usually means your working width is set too narrow, or an offset is not set at all. A dark wedge at the headland is normal. Consistent dark edges on every pass are worth fixing before the next job, and the overlap cost calculator will tell you what they are worth.
How worked area is counted
Worked area is the sum of those rectangles: distance travelled multiplied by working width, added up over the job. That is the figure a contractor bills on and an operator checks against the field size.
Worth understanding: because it is a running total of ground worked, driving over the same strip twice counts it twice. That is the right answer for “how much did I apply” and the wrong answer for “how big is this field”. If you want the second number, measure the boundary instead. The free field boundary mapper does it from satellite imagery in a browser, with no app needed.
What happens when the signal is poor
GPS itself needs no mobile connection, so coverage recording continues in a field with no bars. What does need data is the satellite map imagery underneath, and previously viewed areas stay cached, so ground you have worked before still has a backdrop.
Fix quality is a different question from mobile coverage. Under a tree line or beside a shed the reported accuracy degrades, and a position that is tens of metres out would paint coverage in the wrong place. AgriPilot keeps recording the track but stops painting coverage once accuracy falls past a usable threshold, and shows the current accuracy on screen so you can see why. It is better to have a visible gap you know about than a confident-looking band in the wrong field.
A coverage map is not a spray record
It records where you drove: area, distance, duration, and the shape of the job. It does not record product, rate, batch number, weather at the time of application, or the operator’s licence details, which are the things a compliance record needs. If you need that paperwork, keep it in something built for it; we make a separate app, Spraybook, for exactly this reason.
What you can take away is the track itself. Every recorded session exports as a GPX file, which opens in QGIS, Google Earth and most farm mapping software, so the coverage can go into whatever system holds your records.
Ready to try it
Watch the paddock fill in behind you
AgriPilot paints coverage live while you drive, keeps recording with no mobile signal, and saves every job with its area, distance and duration. There is a 7-day free trial.